Project 3 (WP4-WP3-TWP3): Assessing the robustness of multi-region and multi-sectoral indicators of climate change impacts
Project lead: Benjamin Sultan
Post-doctoral researcher: Yan Zhao
Project start/end: May 2013 – April 2015
We started the development of a methodology to analyze tailored indicators of climate change and associated uncertainties, that we called the “indicator factory”. The goal is to build the bridge between the output of climate models and environmental variables that are relevant for impact assessment, whether they relate to the mean state of the environment or extreme events. Our aim is to propose, evaluate, and eventually calculate, indicators of climate change that are communicable and useful for the scientific community and/or the stakeholders.
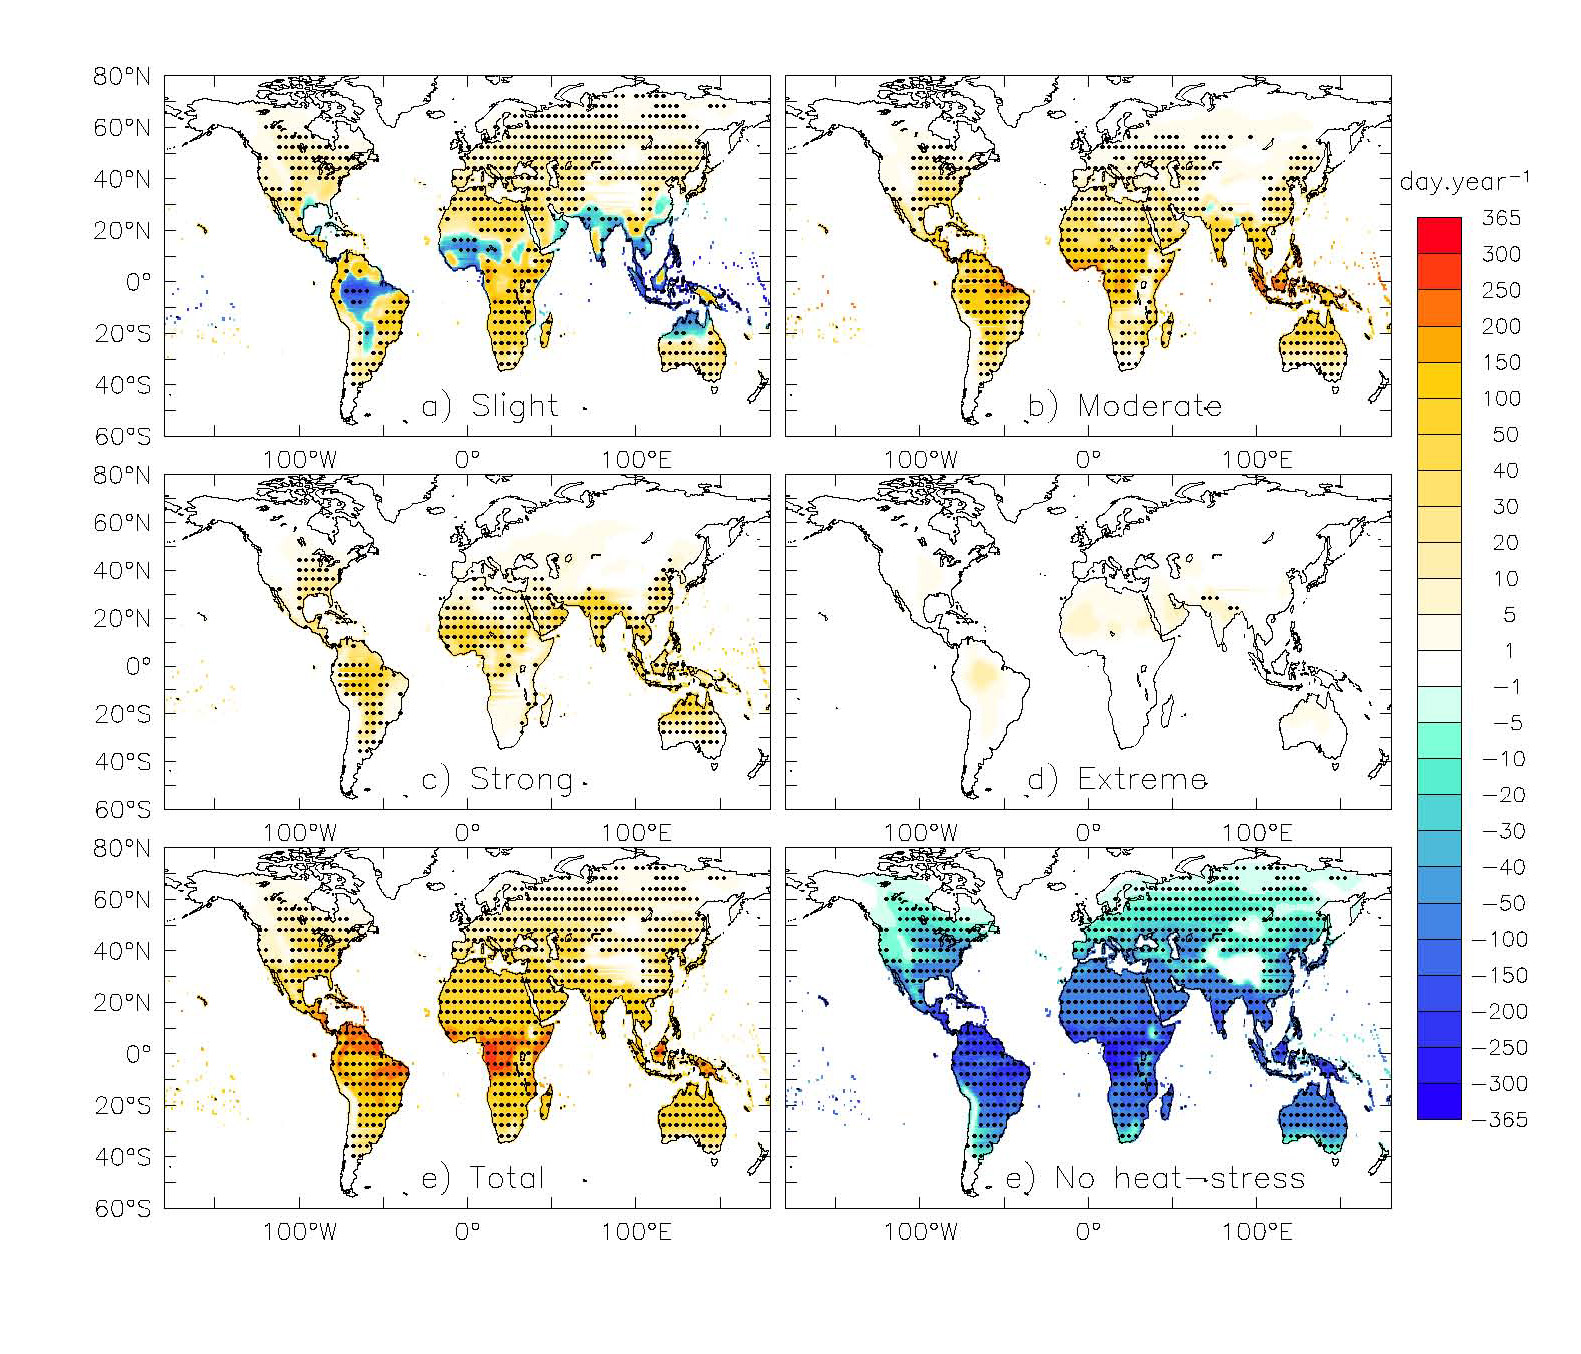
The first choice was made to focus on health-related heat stress indicators, which account for the combined effects of temperature and humidity on comfort and health. Y. Zhao and her colleagues used three widely-used heat stress indicators, and showed that their main differences come from the importance of humidity when computed from the observed climate. Using an ensemble of 21 CMIP5 simulations (historical + RCP8.5), they found that climate models tend to underestimate heat stress over the Tropics, because of dry and cold biases, while warm and dry biases balance each other at higher latitudes. All climate models project increased heat stress with global mean changes comparable to the one of surface air temperature, despite less contrasted patterns because of the buffering effect of humidity. In particular, heat stress indicators increase more than temperature in warm and humid areas of the Tropics, where the number of days subjected to severe heat stress increases consistently amongst the climate models. The dispersion between climate models is smaller than the climate change signal, but the choice of heat stress index carries as much uncertainty. An application of impacts of heat-stress on work productivity is being performed over China using different climate change scenarios (rcp2.6, rcp4.5 and rcp8.5).
Position offer and results (January 2017 update)
Figure 1 :
Change in ensemble mean annual frequency of the four heat stress classes based on HD, between 2070-2099 and 1979-2005. (a) Slight, (b) Moderate, (c) Strong, (d) Extreme, (e) total heat-stress, (f) no heat-stress. Areas with dots indicate regions with robust changes (at least 18 models agree on the sign of change)